> For the complete documentation index, see [llms.txt](https://kranyyy.gitbook.io/cyber/llms.txt). Markdown versions of documentation pages are available by appending `.md` to page URLs; this page is available as [Markdown](https://kranyyy.gitbook.io/cyber/practica-4_4-splunk-exploring-spl.md).
# Practica 4\_4 Splunk exploring spl

**TASK 2**
Vamos a comenzar entrando a la maquina:

Clickamos en search and reporting:

Y como nos dice tryhackme trabajaremos sobre el index=”windowslogs” , aquí ya podemos ver el nombre del host.
**TASK 3**
Vamos a comenzar yéndonos al serach history que esta al principio y buscamos el séptimo filtro que se utilizo quitando los dos primeros que escribi yo:

Para saber que ip es la que mas eventos genero :

Como podemos ver fue la 172.90.12.11 , ya que las primeras no cuentan por que es mi propia maquina.
Para la siguiente maquina vamos a poner el filtro de tiempo que nos dicen en tryhackme y ver el numero de eventos que se generaron:


**TASK 4**
(info de marcadores para splunk)
Comparison Operators
These operators are used to compare the values against the fields. Some common comparisons operators are mentioned below:
|
This operator is used to match values against the field. In this example, it will look for all the events, where the value of the field UserName is equal to Mark.
|
|
Not Equal to
|
!=
| UserName!=Mark |
This operator returns all the events where the UserName value does not match Mark.
|
|
Less than
|
<
| Age < 10 |
Showing all the events with the value of Age less than 10.
|
|
Less than or Equal to
|
<=
| Age <= 10 | Showing all the events with the value of Age less than or equal to 10. |
|
Greater than
|
>
|
Outbound\_traffic > 50 MB
|
This will return all the events where the Outbound traffic value is over 50 MB.
|
|
Greater Than or Equal to
|
>=
| Outbound\_traffic >= 50 MB | This will return all the events where the Outbound traffic value is greater or equal to 50 MB. |
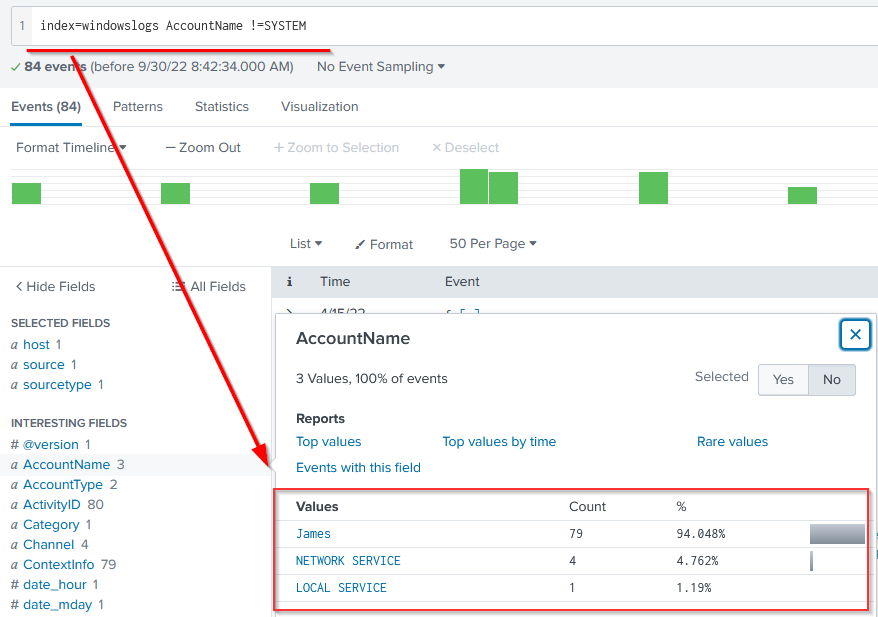
Lets use the comparison operator to display all the event logs from the index "windowslogs", where AccountName is not Equal to "System"
Search Query: `index=windowslogs AccountName !=SYSTEM`
Boolean Operators
Splunk supports the following Boolean operators, which can be very handy in searching/filtering and narrowing down results.
|
Ignore the events from the result where field\_A contain the specified value.
|
|
OR
|
field\_A=value1 OR field\_A=value2
|
Return all the events in which field\_A contains either value1 or value2.
|
|
AND
| field\_A=value1 AND field\_B=value2 | Return all the events in which field\_A contains value1 and field\_B contains value2. |
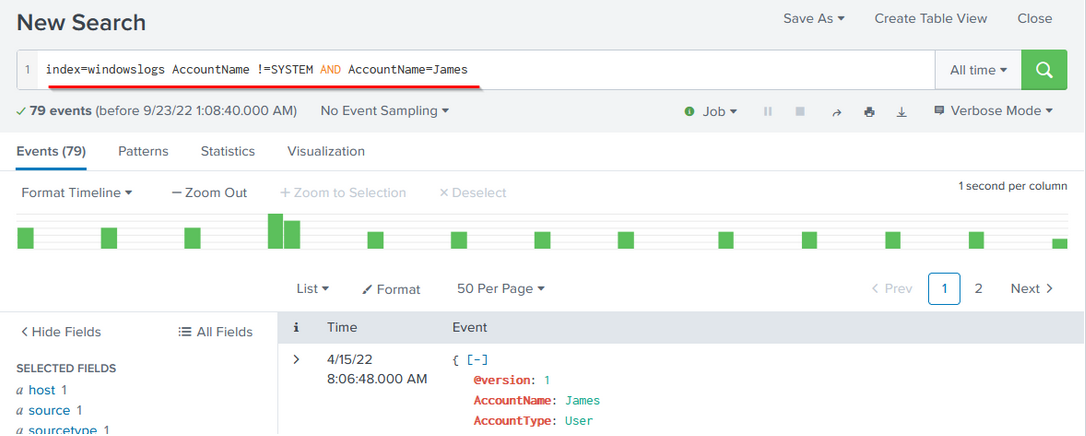
To understand how boolean operator works in SPL, lets add the condition to show the events from the James account.
Search Query: `index=windowslogs AccountName !=SYSTEM AND AccountName=James`
Wild Card
Splunk supports wildcards to match the characters in the strings.
| Wildcard symbol |
|
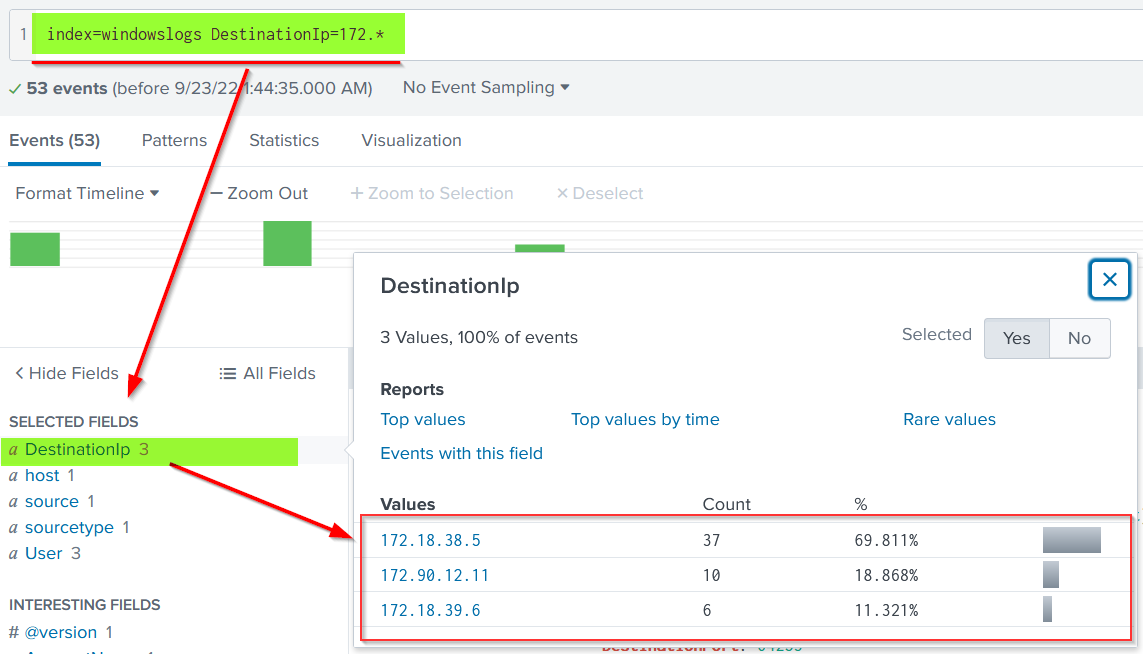
In the events, there are multiple DestinationIPs reported. Let's use the wildcard only to show the DestinationIP starting from 172.\*
Search Query: `index=windowslogs DestinationIp=172.*`
Para el primer ejercicio nos pide cuantos eventos hay con el eventid = 1 y el nombre “\*James\*” , CUIDADO CON LAS MAYUSCULAS AL PRINCIPIO DE CADA FLAG!!!!:

Luego nos piden los eventos con una ip y un puerto concreto :

A continuación dada una query ya por thm , ver que source ip tiene mas counts:


Luego nos piden el numero de eventos que contengan el nombre cyber:

Respueta 0
Pero con cyber\*:

**TASK 5**
Fields
|
Fields command is used to add or remove mentioned fields from the search results. To remove the field, minus sign ( - ) is used before the fieldname and plus ( + ) is used before the fields which we want to display.
| |
|
Syntax
| \| fields \ \ | |
|
Example
|
| fields + HostName - EventID
|
Let's use the fields command to only display host, User, and SourceIP fields using the following syntax.
Search Query: `index=windowslogs | fields + host + User + SourceIp`
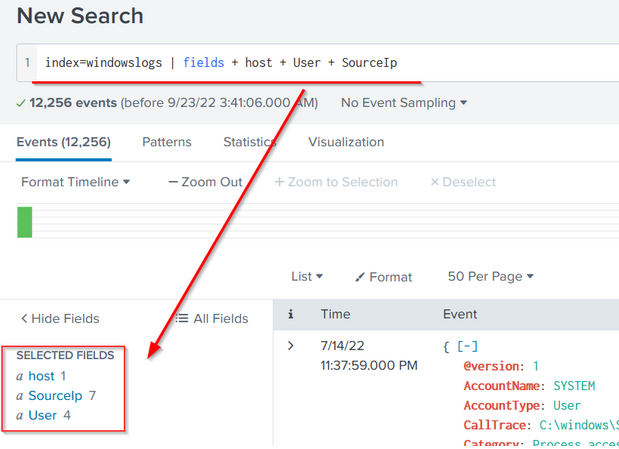
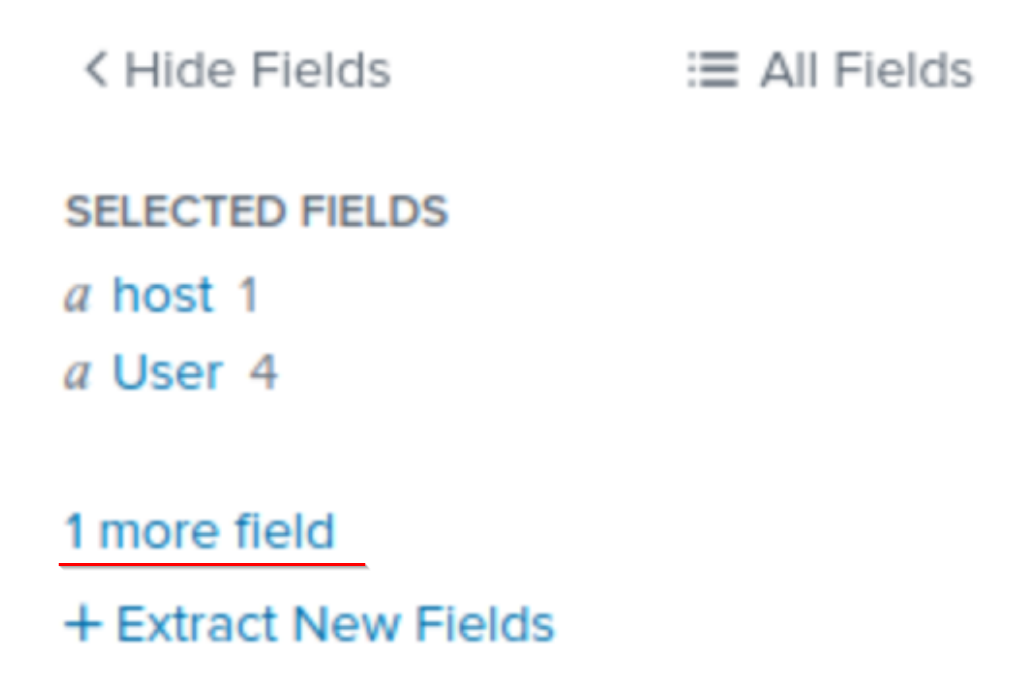
Note: Click on the More field to display the fields if some fields are not visible.
Search
|
| This command is used to search for the raw text while using the chaining command `\|` | |
|
Syntax
|
| search \
|
|
Example
|
| search "Powershell"
|
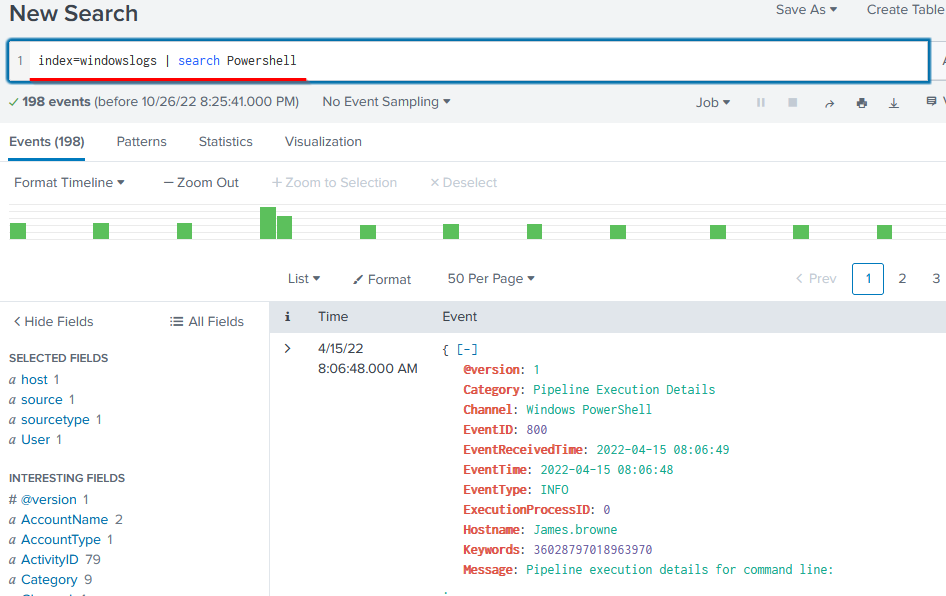
Use the search command to show all the events containing the term Powershell. This will return all the events that contain the term "Powershell".
Search Query: `index=windowslogs | search Powershell`
Dedup
|
| Dedup is the command used to remove duplicate fields from the search results. We often get the results with various fields getting the same results. These commands remove the duplicates to show the unique values. | |
|
Syntax
|
| dedup \
|
|
Example
|
| dedup EventID
|
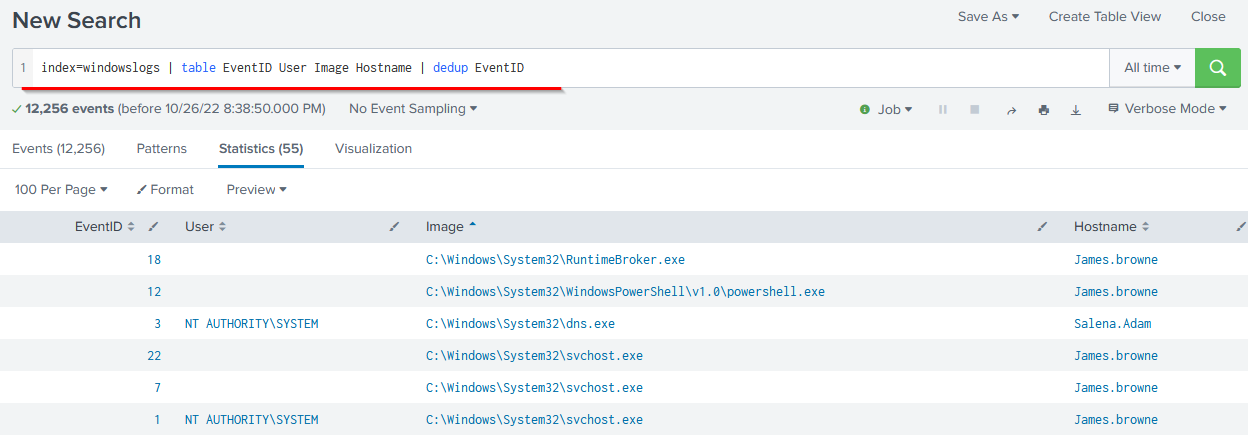
We can use the dedup command to show the list of unique EventIDs from a particular hostname.
Search Query: `index=windowslogs | table EventID User Image Hostname | dedup EventID`
Rename
|
| It allows us to change the name of the field in the search results. It is useful in a scenario when the field name is generic or log, or it needs to be updated in the output. | |
|
Syntax
|
| rename \
|
|
Example
| \| `rename User as Employees` | |
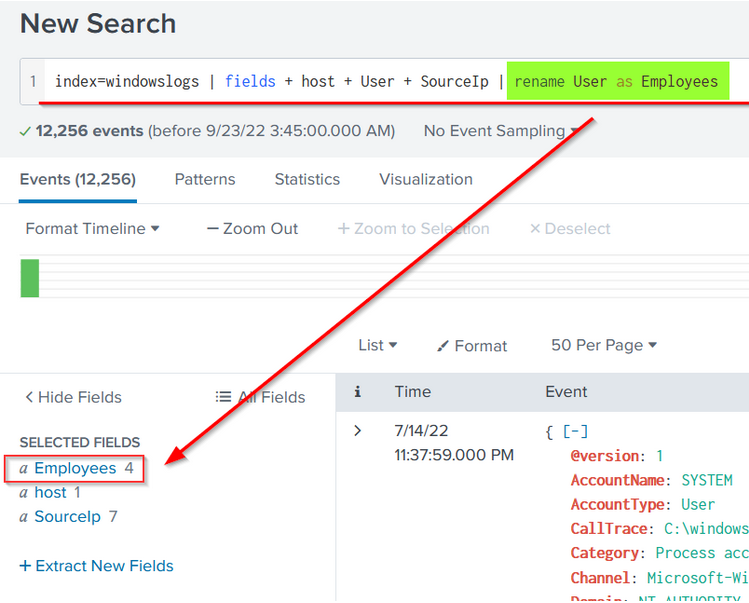
Let's rename the User field to Employees using the following search query.
Search Query: `index=windowslogs | fields + host + User + SourceIp | rename User as Employees`
Para el primer ejercicio que te pide el event id de la 3 linea dada el filtro en thm:
4103
Para el segundo ejercicio te dice que de la query anterior antes del reverse le hagas un dedup Hostname y digas el nombre del primer hostname:
Salena.adam
**TASK 6**
SPL provides various commands to bring structure or order to the search results. These sorting commands like `head`, `tail`, and `sort` can be very useful during logs investigation. These ordering commands are explained below:
Table
|
Explanation
| Each event has multiple fields, and not every field is important to display. The Table command allows us to create a table with selective fields as columns. | | |
| ---------------------- | ------------------------------------------------------------------------------------------------------------------------------------------------------------ | ----------------------------------------------- | ------------------------------------------------------------------------------ |
|
Syntax
|
| table \ \
| |
|
Example
|
| table
| head 20 # will return the top 20 events from the result list.
|
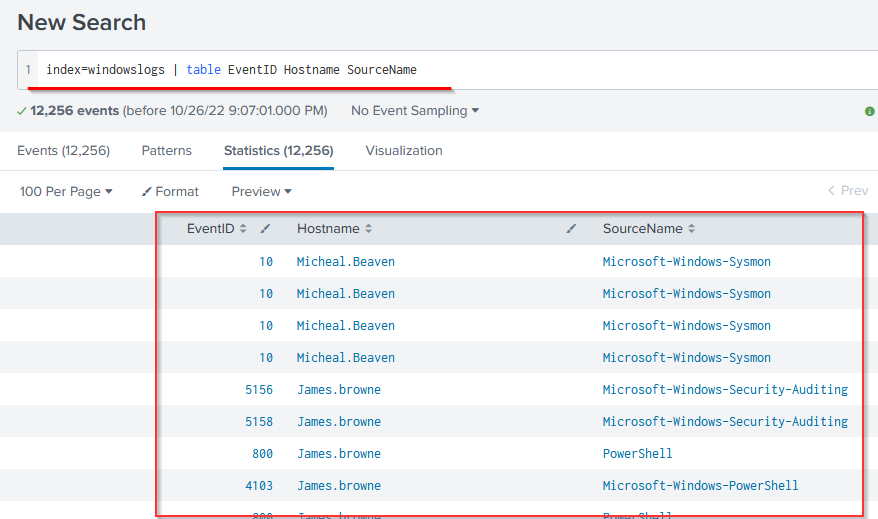
This search query will create a table with three columns selected and ignore all the remaining columns from the display.
Search Query: `index=windowslogs | table EventID Hostname SourceName`
\
\
Head
|
Explanation
|
The head command returns the first 10 events if no number is specified.
| head # will return the top 10 events from the result list
| head 20 # will return the top 20 events from the result list
|
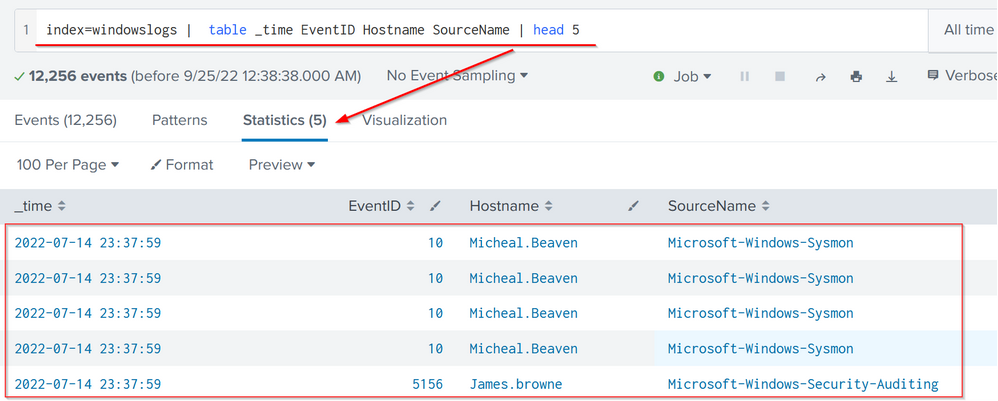
The following search query will show the table containing the mentioned fields and display only the top 5 entries.
Search Query: `index=windowslogs | table _time EventID Hostname SourceName | head 5`
Tail
|
Explanation
| The Tail command returns the last 10 events if no number is specified. | | |
| ---------------------- | ---------------------------------------------------------------------- | ---------------------------------------------------------------------------------- | -------------------------------------------------------------------------------- |
|
Syntax
| \| tail \ | | |
|
Example
|
| tail # will return the last 10 events from the result list
| tail 20 # will return the last 20 events from the result list
|
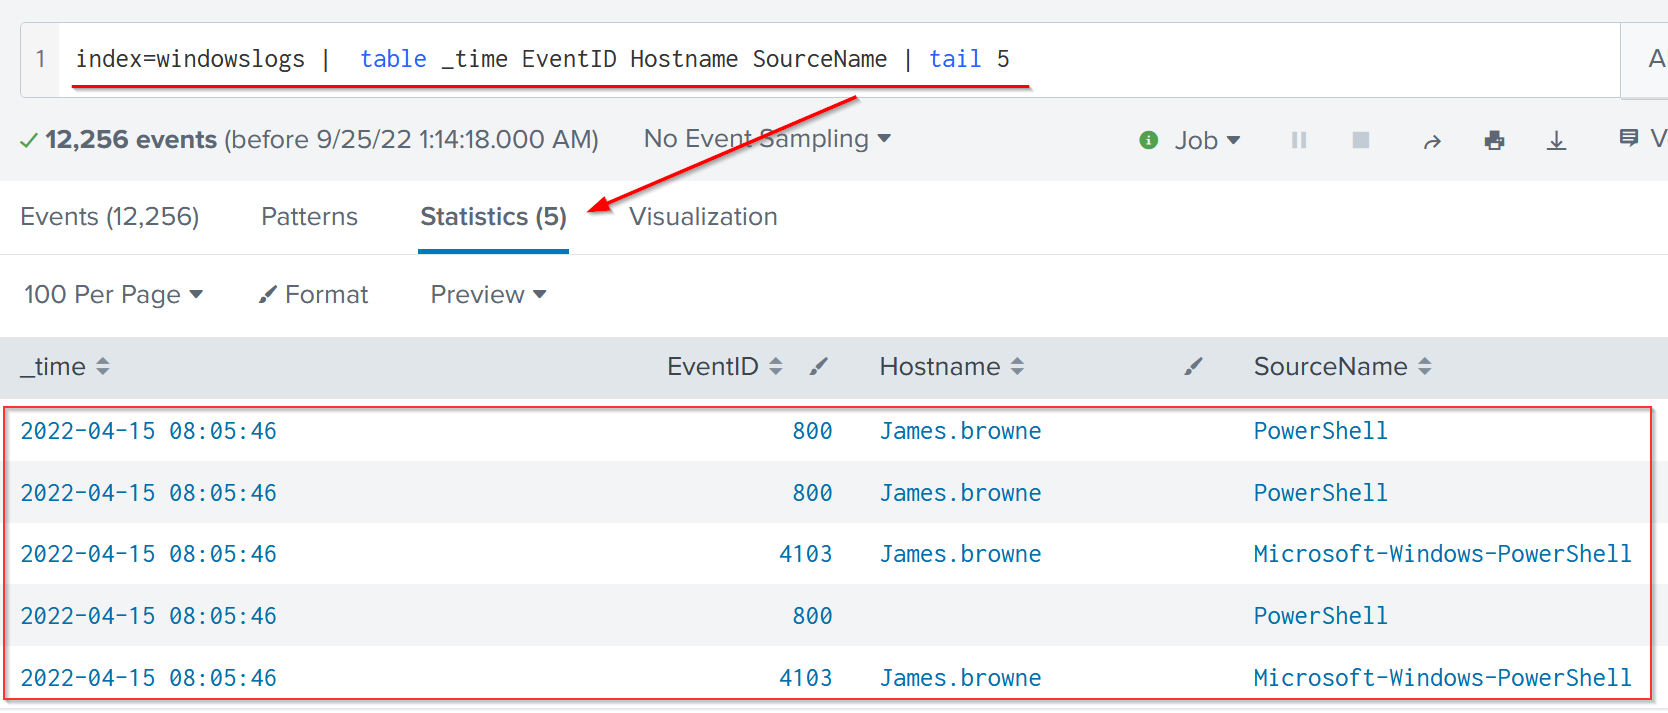
The following search query will show the table containing the mentioned fields and display only 5 entries from the bottom of the list.
Search Query: `index=windowslogs | table _time EventID Hostname SourceName | tail 5`
sort
|
Explanation
|
The Sort command allows us to order the fields in ascending or descending order.
| \| `sort Hostname` # This will sort the result in Ascending order. | |
The following search query will sort the results based on the Hostname field.
Search Query: `index=windowslogs | table _time EventID Hostname SourceName | sort Hostname`
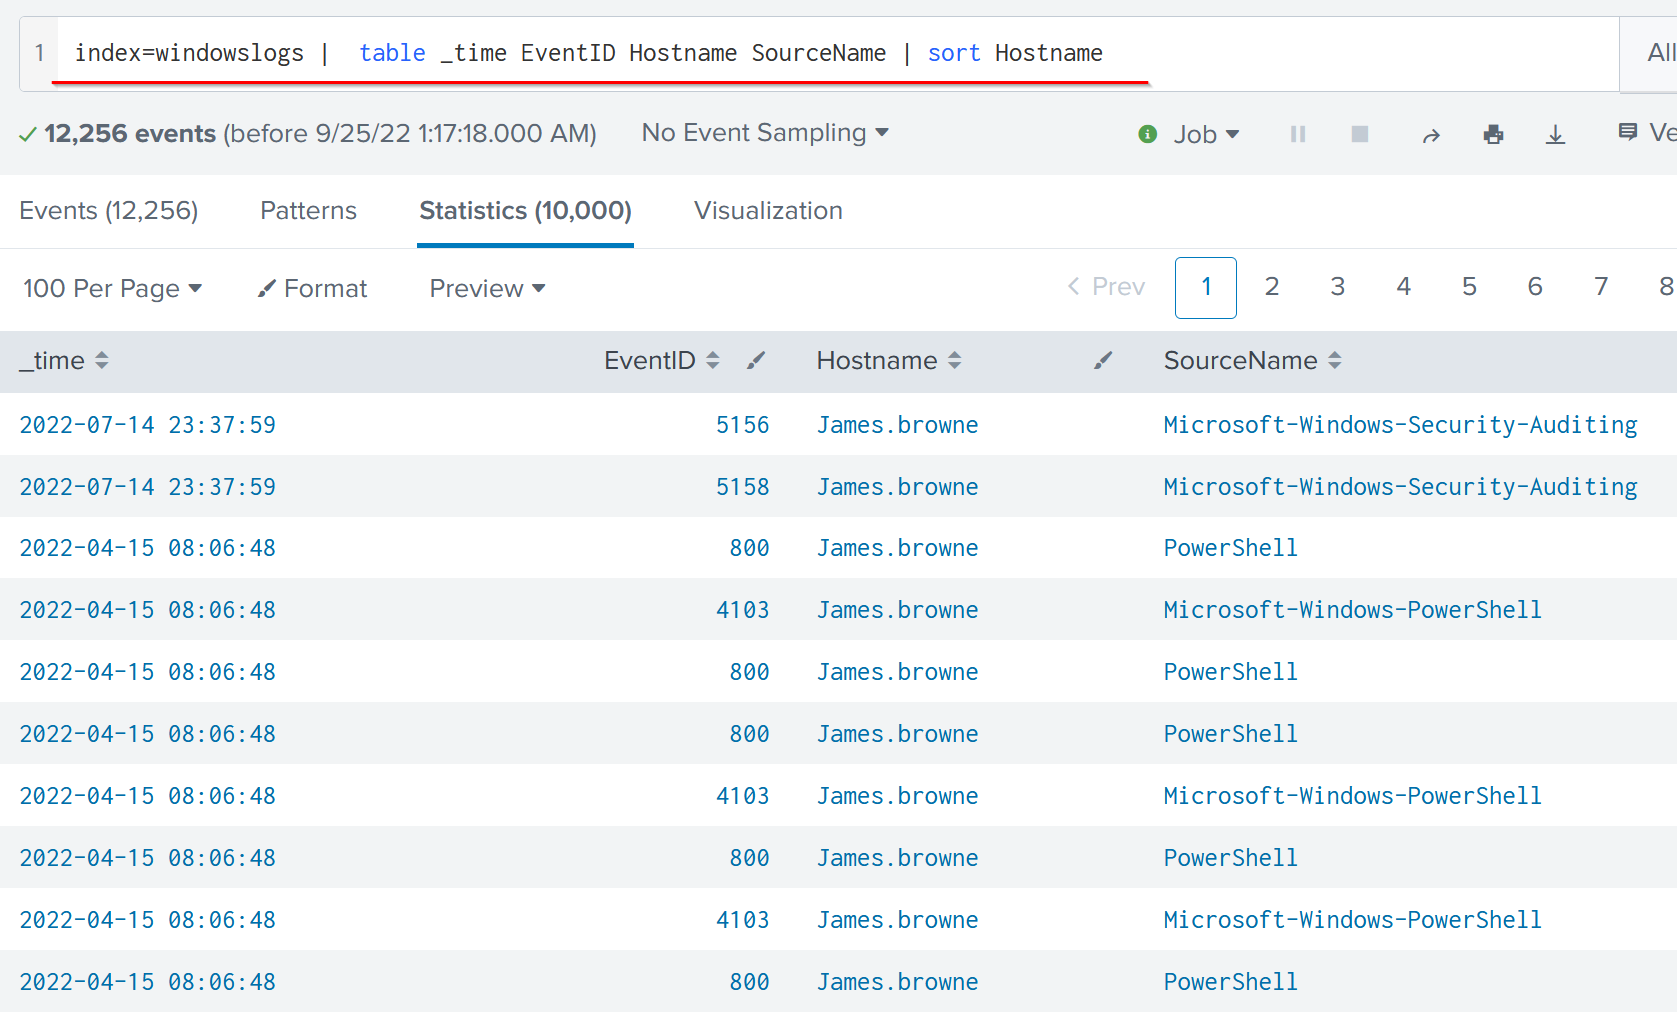\
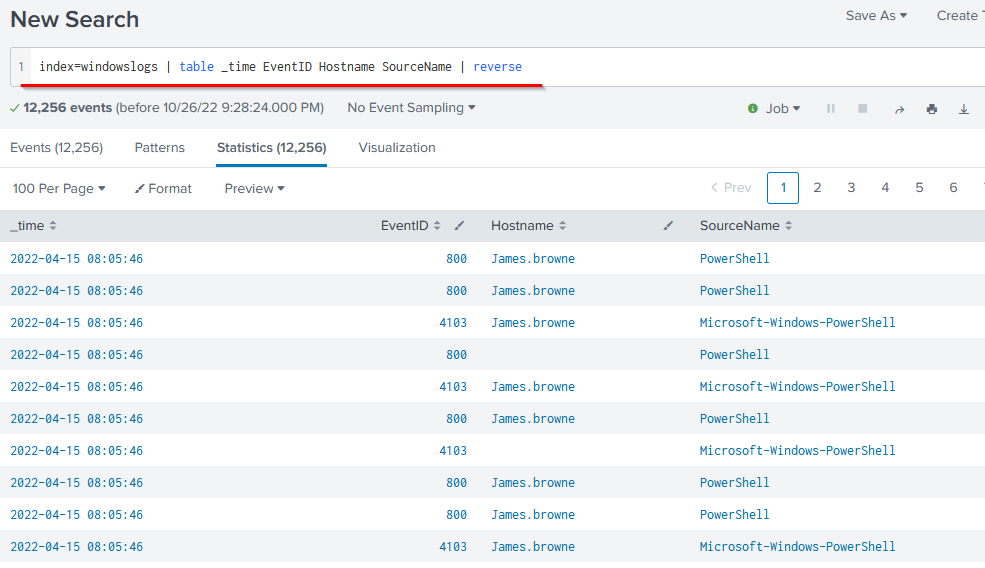
Reverse
|
Explanation
|
The reverse command simply reverses the order of the events.
Nos piden el nombre del hostname de hacerl el reverse a la query que nos da thm:
Ahora te piden que a la primera query le hagas un tail y digas el ultimo eventid:
4103
Y por ultimo que hagas un sort en el sourcename:
**TASK 7**
Transformational commands are those commands that change the result into a data structure from the field-value pairs. These commands simply transform specific values for each event into numerical values which can easily be utilized for statistical purposes or turn the results into visualizations. Searches that use these transforming commands are called transforming searches. Some of the most used transforming commands are explained below.
General Transformational Commands
Top
|
| The highlight command shows the results in raw events mode with fields highlighted. |
|
Syntax
| highlight \ \ |
|
Example
| `highlight User, host, EventID, Image` |
The following command will highlight the three mentioned fields in the raw logs
Search Query: `index=windowslogs | highlight User, host, EventID, Image`
STATS Commands
SPL supports various stats commands that help in calculating statistics on the values. Some common stat commands are:
|
| This command is used to calculate the average of the given field. | stats avg(field\_name) | stats avg(product\_price) |
|
Max
| It will return the maximum value from the specific field. | stats max(field\_name) | stats max(user\_age) |
|
Min
| It will return the minimum value from the specific field. | stats min(field\_name) | stats min(product\_price) |
|
Sum
| It will return the sum of the fields in a specific value. | stats sum(field\_name) |
stats sum(product\_cost)
|
|
Count
| The count command returns the number of data occurrences. | stats count(function) AS new\_NAME | stats count(source\_IP) |
Splunk Chart Commands
These are very important types of transforming commands that are used to present the data in table or visualization form. Most of the chart commands utilize various stat commands.
Chart
|
| The timechart command returns the time series chart covering the field following the function mentioned. Often combined with STATS commands. |
|
Syntax
| \| timechart function \ |
|
Example
| \| `timechart count by Image` |
The following query will display the Image chart based on the time.
Search Query: `index=windowslogs | timechart count by Image`
\
Cual es el top 6 de imágenes y di el numero ce counts:
196
En el siguiente ejercicio nos piden el usuario con menos counts por medio del comando rare :
James
Y para el ultimo: